Originally posted on the Simple engineering blog; also presented at PyOhio 2016 and CloudDevelop 2016
Early in 2014, Simple was a mid-stage startup with only a single analytics-focused employee. When we wanted to answer a question about customer behavior or business performance, we would have to query production databases. Everybody in the company wanted to make informed decisions, from engineering to product strategy to business development to customer relations, so it was clear that we needed to build a data warehouse and a team to support it.
Today, we are over a year into a partnership with BBVA and Simple is nearly 300 employees strong. We have a Director of Data leading a team of five engineers and five analysts who have access to a wealth of business data stored centrally in Amazon Redshift as our data warehouse. Building robust, near real-time analytics capabilities wasn’t easy and we learned a few hard lessons along the way. This post shares some details of what our current data infrastructure looks like, how we make use of it, and some of the decisions that led us here.
How We Structure Our Data Team
Our analysts and engineers are a resource for the rest of the company, providing the data to inform decisions. Some examples of how we collaborate include:
- Working with the Product Team to interpret event tracking data to help them understand how users interact with the app and how the team should prioritize potential features.
- Partnering with Risk to recognize atypical usage patterns and pinpoint emerging forms of fraud.
- Building dashboards to help Customer Relations anticipate staffing needs, optimize their schedule, and effectively respond to emergent issues.
- Providing metrics to our Executive Leadership Team and the Board to guide decisions about strategic vision for the company.
It’s important for the entire company to have access to data. Folks from any department are able to submit data analysis and infrastructure requests to our team via GitHub* issues. A rotating weekly analytics lead triages and tags those issues throughout the week.
As Simple grows and data remains a top priority, we’re seeing more requests than we can fulfill, so we’re working to overhaul this system to help prioritize projects while allowing for ongoing company requests. We’re also seeing data requests become increasingly specific as the company grows; some of our analysts already spend more than 50% of their time pairing with a specific team and there is likely going to be more specialization going forward.
Our data analysts and data engineers work as a single team. We sit together in the office and share a management structure. While in theory responsibilities are distinct between the engineers who build the infrastructure that feeds the warehouse and the analysts who answer business questions based on that data, we’ve seen significant overlap between analyst and engineering work and benefited from a tight feedback loop. When an incoming data request requires something that’s not already in Redshift, analysts know exactly who to work with and our engineers can often add a new data source within days by hooking a new input into one of our existing services. We’ve also seen cooperative projects where an engineer brings programming expertise to an analysis problem or an analyst builds a web application to address a particular analysis workflow.
Our Data Infrastructure
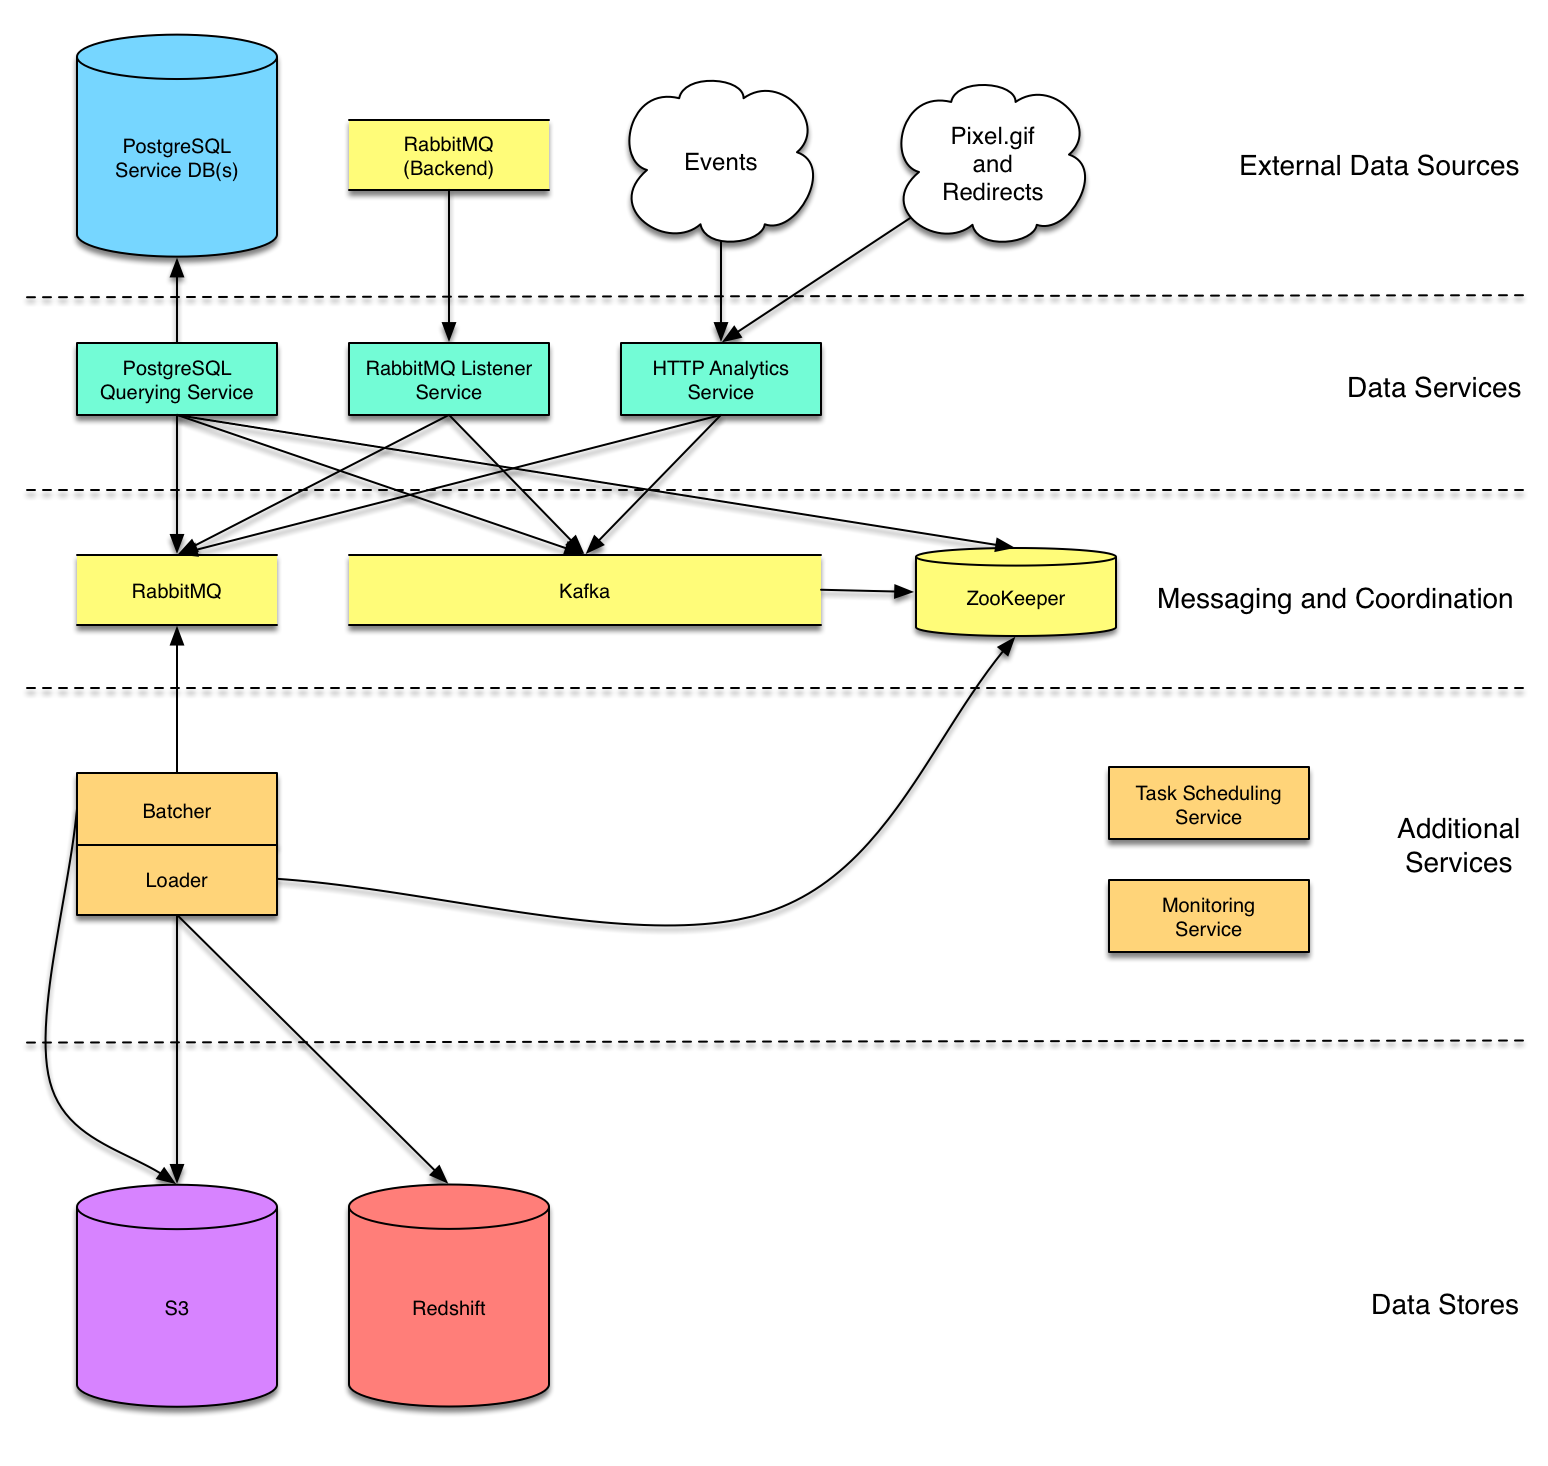
Most of Simple’s data infrastructure focuses on capturing data from production services and filing it to Amazon Redshift as our data warehouse. The warehouse stores data originating from PostgreSQL databases, message queues, and public HTTP endpoints.
We chose Redshift as our data warehouse for integration and scalability:
- Simple’s backend infrastructure all lives in Amazon Web Services (AWS), so Redshift was easy to deploy and integrate into our existing environment.
- Redshift is massively scalable and relatively inexpensive. While we currently warehouse just under 1 TB in Redshift, we expect our data ingestion to increase exponentially in the coming years.
- Redshift’s interface is SQL, which our analysts know fluently and which is instantly familiar to many other folks across the company.
Redshift Loader Service
Simple’s computing backend follows a service-oriented architecture and our Technical Operations team has developed great operational support for deploying and maintaining microservices. Because of that existing experience and support, we’ve largely adopted the same pattern for building our data pipelines.
We started with a centralized warehouse loader service, which reads from a message queue (each message representing a single row to load into the warehouse), batches messages per table to S3, and finally runs COPY statements to get the data from S3 into Redshift. Upstream services, then, are able to file data to Redshift by simply sending messages that adhere to our warehouse-specific JSON schema to a RabbitMQ exchange or Kafka topic.
Because the schema of incoming data sometimes changes, we’ve taken to maintaining an archive of all the S3 batches produced by the loader. We don’t yet have an automated system to alert us to changes in the schema of incoming messages, so the archive gives us some flexibility to react to schema changes after the fact, adding a relevant column in Redshift and replaying from the archive in order to backfill the new field.
HTTP Analytics Service
The first upstream service we built was an HTTP service with publicly-exposed endpoints that could be accessed by our marketing site, web app, and mobile clients. For every incoming request, the service transforms a JSON payload into the format expected by our loader service and publishes that to the loader’s RabbitMQ exchange.
Message Queue Listener Service
Our backend services often use RabbitMQ to pass messages to one another. We tap into those exchanges (and our data engineers have occasionally added new events in backend services specifically for analytics ingestion) in a small listener service. It accepts JSON payloads and, similar to our HTTP service, performs some light transformations to coerce them into a format suitable for our loader, finally republishing them to the loader’s exchange.
We are starting to use Kafka and Amazon’s SQS in our backend as well, so we may build additional listeners in the future or pursue a more general-purpose message shunting service using heka.
PostgreSQL Database Querying Service
PostgreSQL is the datastore of choice for much of our backend and we often want to mirror our production database tables in the warehouse. We currently meet that need by spinning up instances of a database querying service that periodically queries for new rows in configured tables, publishing those rows to RabbitMQ for our loader service to ingest. By directly querying database tables, we’re able to get a full backfill of existing data (which we’re not able to achieve by listening on message queues).
While extracting rows from a database via SQL queries is conceptually simple, it has in practice required significant configuration. In order to pull updates incrementally, we have to keep track of the most recently extracted timestamps per table, and we can work with tables that contain a column that records insertion time. We have sometimes needed to add updated_at columns or entirely new history tables to backend services in order to identify new rows and understand when rows have been deleted.
Our Technical Ops team is currently working on migrating our backend databases to PostgreSQL 9.4, which will allow us to take advantage of the new logical decoding feature to monitor database updates. The approach we’re taking is very similar to bottledwater where a PostgreSQL plugin publishes updates to Kafka and we send those updates to the loader service.
Redshift Performance Monitoring Service
Once we built a minimum viable warehouse, various business units were relying on the data to be available and accurate on-demand. With the thrill of that buy-in comes the responsibility of ensuring smooth operation of the infrastructure, prompting us to build out our monitoring and alerting capabilities. We again borrowed well-established practices and infrastructure from our Backend Engineering and Technical Operations teams in designing a solution for capturing Redshift metrics.
Most of our backend services run on the JVM, using the Dropwizard framework and emitting metrics using Dropwizard’s excellent metrics toolkit. We use that metrics toolkit to send data to Graphite and we typically visualize it through Grafana dashboards. To hook into that infrastructure, we built a service entirely dedicated to metrics collection. It runs periodic (usually once per minute) queries against Redshift system tables as well as requests to AWS’s CloudWatch service, which maintains various statistics on Redshift cluster performance automatically.
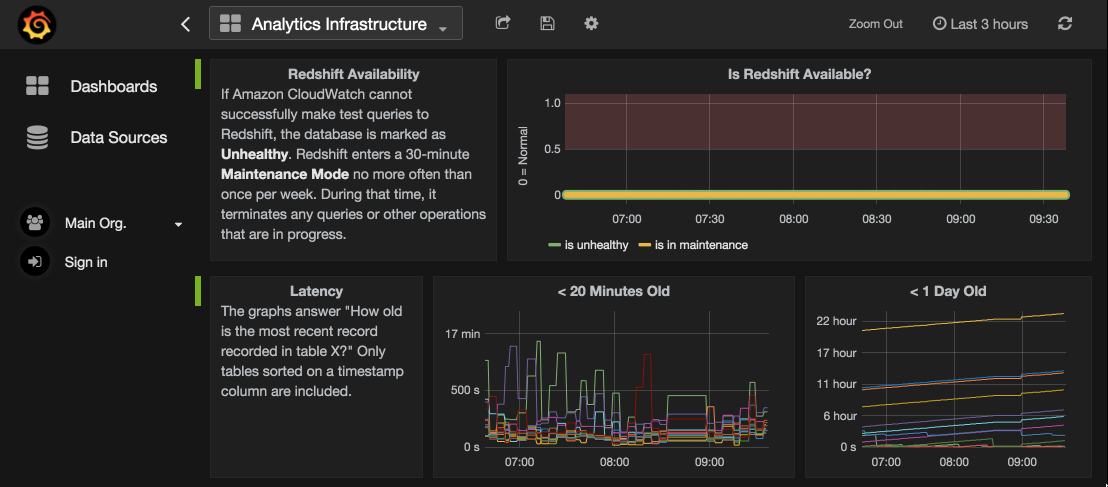
Collecting these metrics gives us a historical view of performance and has been helpful in identifying bottlenecks in our data pipeline. We also have several alerting mechanisms set up that notify us via page or Slack message about symptoms that could indicate a pipeline problem. It has been particularly useful to monitor the most recent timestamp on some tables so that we receive an alert when those tables fall more than an hour behind.
Scheduled Tasks (when all else fails, import a CSV)
Every organization ends up having a few bits of important information stashed in awkward, out-of-the-way places that either aren’t traditional datastores or require special handling because they live outside of our infrastructure. In order to pull such data into the warehouse, you sometimes need to rely on simple scheduled tasks that hit an API or copy a file.
We built a basic task-scheduling service on top of Celery to meet some of these needs. Data sources we handle through scheduled tasks include:
- CSV files containing email interaction data that we pull via SFTP from ExactTarget, our email service provider
- Our Customer Relations team’s staff schedules, which we pull via the Google Sheets API
- Daily summaries of our ad spend that we pull from Nanigans through their HTTP API
- Notes and metadata from GitHub issues that we pull via HTTP API from our GitHub Enterprise installation
We also use this service to run nightly maintenance activities on Redshift, VACUUMing tables and recreating various analysis-specific tables, as discussed in the next section.
Transforming Data for Analysis
The Extract-Transform-Load (ETL) process feeding a data warehouse looks very different from one organization to the next, and is rarely as simple as the three simple steps implied by the name. The reality is usually more like (ET*L)+ (for the regular expression-inclined) with the data passing through multiple systems, encountering an arbitrary number of transformations along the way.
Our schema in Redshift generally remains very close to the structure of the original data sources, an approach that keeps pipelines simpler and lets us remain flexible about what we can do with the raw data. The downside to this approach is that the resultant data isn’t very friendly for analysis.
We’ve taken to using Redshift itself as a transformation engine, running various nightly SQL jobs which create “materialized views” optimized for specific analysis tasks (Redshift doesn’t support true materialized views, but we’re doing something similar by creating static tables that we tear down and recreate periodically). These files generally consist of a single CREATE TABLE AS statement and they are read by our task scheduling service as input to a view materialization job. Because the logic is pure SQL, it’s accessible to everyone on our team. Our analysts will often write new transformation tasks for the nightly job as a first step when venturing into a new problem domain.
We’ve found that Redshift can perform these data transformations extremely efficiently, but only if they’re written in a way that takes advantage of the distributed structure of the data. Redshift distributes each table across many “slices” living on different servers, so naive SQL joins can require broadcasting entire tables across the network, leading to poorly performing queries. To provide more opportunity for efficient joins, we have started laying out the distribution and sort keys on our tables with the explicit goal of maximizing the possibility for efficient merge joins. For most of our tables, that means we choose user ID as both the distribution key and the sort key, often adding some timestamp column as a secondary sort key. We also have developed a best practice of avoiding common table expressions (WITH statements) in our transformations since the query optimizer tends to build those intermediate results in memory and often pulls in cross-slice results unnecessarily. We now use temporary tables in our transformation jobs as a way of breaking up logic into manageable chunks. We can explicitly assign distribution keys and sort keys to those temp tables, giving us more control over what path the overall query executes.
Frontends Make the Warehouse Accessible
Our data analysts make heavy use of SQL clients like Navicat and scripts in R or Python to query Redshift directly. Others at Simple also have direct access, though not everyone is comfortable enough with SQL (or familiar enough with our schema) to write their own queries. As we seek to make data needs self-service, frontends for the warehouse become more and more important.
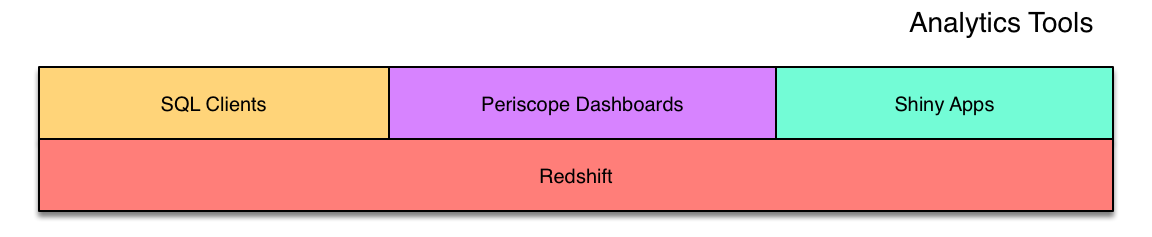
Dashboards are our go-to format for providing insight into a focused subset of the business. We build and host those dashboards on Periscope Data and for many folks at Simple, Periscope is the warehouse.
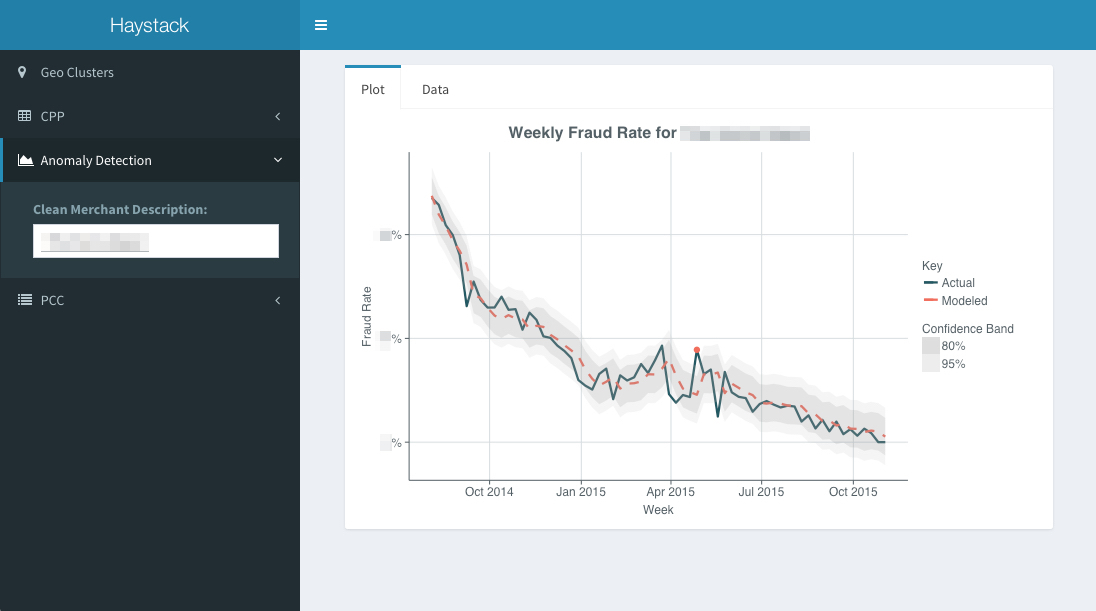
We also provide tooling for some more specific workflows that involve more data input/output than a dashboard can provide. In some cases, we’ve built command-line tools in Python that can take in files or parameters and produce some sort of transformed output. We also recently deployed a Shiny app that gives an interactive interface to an R-based model, presented on the web. Both of these approaches to custom tooling have been labor-intensive, so we’ve only been able to apply them to limited domains where there’s a clear long-term time savings versus querying manually.
Dashboards on Periscope Data
Our Periscope Data frontpage (what employees see by default when they hit periscopedata.com/app) shows progress on the major company-wide goals we’ve defined for the year. One way we measure success is through our Net Promoter Score (NPS) — a modern alternative to traditional customer surveys that gauges a customer’s brand loyalty by asking how likely they are to recommend Simple to their friends. When a customer submits an NPS score, it hits an endpoint on our HTTP analytics service, storing the response in Redshift. That NPS data is visualized front-and-center on our main Periscope dashboard, so that every Simple employee has access to an aggregate view of how well we’re serving our customers and how we’re improving.
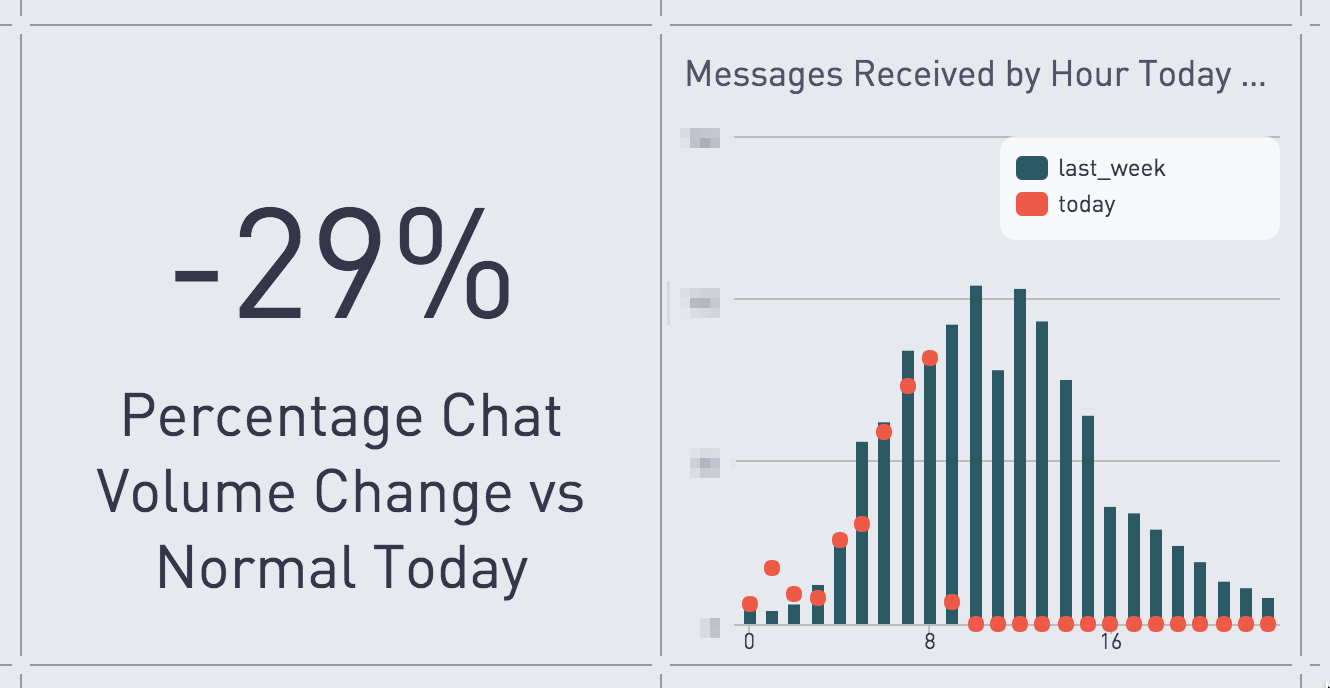
Other dashboards are useful for understanding the operations of specific teams. Much of our contact with customers comes in the form of in-app chats with our Customer Relations (CR) team, and we’ve gotten some great insights from graphing chat queue history. We’ve honed our CR staffing models to respond to trends we see in the chat data (What’s the percent change in volume day-over-day?) and the chat queue dashboard is a motivator for the CR team, allowing them to understand their responsiveness from a number of angles (How many chats do we have outstanding? What’s the oldest chat in the queue? What’s the average time to our first response to a chat?). We love seeing those numbers improve as we get more efficient at answering our customers’ questions and as we make our product easier to use.
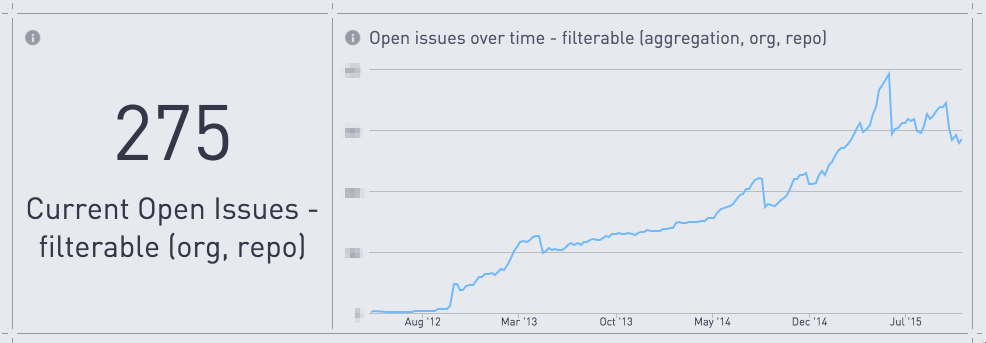
Another way we gain insight into internal operations is by visualizing the discussions that happen on our GitHub Enterprise instance. While GitHub at most organizations is a tool restricted to developers and used primarily for code review, Simple uses it as a central communication tool that all teams use to track issues, whether code-related or not. Our dashboard for GitHub activity is filterable by organization and repository, so individual teams can use it to track how they’re doing on addressing open issues, how long issues are hanging around, and what they might need to prioritize based on volume of +1’s.
Dashboards have in general been a great fit for our data workflows. When our analysts get data requests, creating a dashboard in Periscope is often easier than distributing a CSV, spreadsheet, or static chart. Even if the request is intended as a one-time need, having the solution live in a self-updating dashboard often saves us effort in the long term.
Next Steps
We’re proud of what we’ve built in our data team’s first year and now we’re looking to simplify our infrastructure, extend our capabilities, and meet some existing needs more efficiently. We’ve been building Analytics, now it’s time to scale.
In the coming months, we’ll be working to automate as much maintenance as possible by implementing more robust error handling in our services, looking into open-source task scheduling services that can handle more complex workflows, and building out shiftmanager, a suite of tools that codifies our best practices for Redshift administration via a Python command line interface. Codifying all things data is crucial as we grow. This means increasing knowledge and access for the entire company so that everyone has a better understanding of what we have in the warehouse and what we can build on top of it.
Further Reading
This post took a good deal of inspiration from Building Analytics at 500px which provides a deep and thoughtful look into a data infrastructure with many similarities to what we’ve built at Simple.
Useful tools for working with Redshift:
- awslabs/amazon-redshift-utils - defines some useful queries and views on top of Redshift tables. Some of the queries run by our monitoring service for Redshift are directly adapted from this project.
- EverythingMe/redshift_console - a simple but elegant console for visualizing some important system queries and actually interacting with your cluster (cancel rogue queries directly from the web app).
- sqlalchemy-redshift - a Redshift dialect for SQLAlchemy that includes capabilities for introspecting table structure from an existing cluster.
- SimpleFinance/shiftmanager - a suite of admin tools for Redshift that we created at Simple to codify some of our best practices and present them at the Python command line. We use it to manage user accounts, reliably alter the structure of existing tables, and perform one-off imports of JSON data.
- wrobstory/malort - a tool for sniffing appropriate Redshift column types from nested JSON data, written by one of Simple’s data engineers. We use this when building a pipeline for a datasource with a poorly-defined schema.
Useful data frontends:
- Periscope Data - hosted dashboards for SQL databases.
- Shiny - a web application framework for R.
- Grafana - a great dashboard tool for metrics data.
Open-source tools for task scheduling and data pipeline management: